


Why Bitcoin is About to Rally
Putting all my chips on the table...

Before we get started, I want to welcome the +21 subscribers who signed up for the “Let’s Analyze” newsletter in the last week! If you want to join our community, make sure to sign up here:
It’s been a quiet spring for Bitcoin.
After surging +80% to start the year, the world’s largest cryptocurrency has traded sideways for four months.
In technical analysis, this is known as a “consolidation phase.”
However, it looks like this phase is coming to an end…

…and Bitcoin is about to make its next leg higher.
My Original Bitcoin Prediction Came True
I wrote in this newsletter in April 2023 that I thought we were at the start of a new crypto bull market.
That was proven correct, as Bitcoin alone as surged over +180% since releasing that newsletter…

…with many other cryptocurrencies surging orders of magnitude more. I also went on record in October 2023 stating I have a Bitcoin target price of $165,000 this cycle.
This is based on flows from the recently approved Bitcoin ETFs, previous crypto cycle, and the Net Unrealized Profit and Loss Indicator (NUPL).
But while Bitcoin has moved sideways for months, the the technicals show Bitcoin is on the verge of a massive breakout.
What is Technical Analysis?
Before we get into why Bitcoin is primed to rally, you first need to understand the basics of technical analysis.
Technical analysis is a method used to evaluate and forecast the future price movements of a security by examining past market data, primarily price and volume.
Unlike fundamental analysis, which considers economic and financial factors, technical analysis focuses on identifying patterns and trends in trading activity.
Here are a few key components:
Charts: Technical analysts use various types of charts, such as candlestick, line, and bar charts, to visualize price movements over different periods.
Indicators: These are mathematical calculations based on historical price and volume data. Common indicators include Moving Averages, Relative Strength Index (RSI), and Bollinger Bands, which help identify potential entry and exit points.
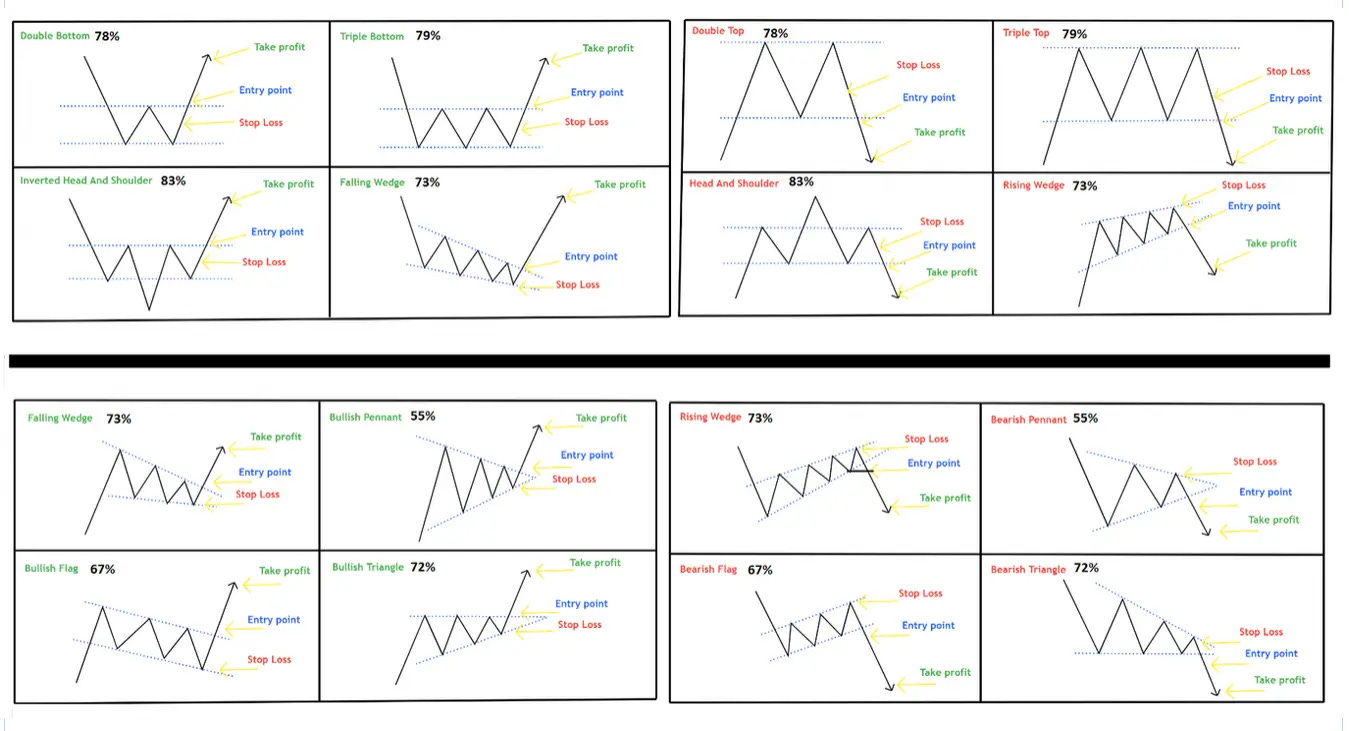
Patterns: Analysts look for specific patterns that can signal future price movements. Examples include head and shoulders, double tops and bottoms, and triangles.
And what we’re going to talk about now is called time frame analysis. See, Bitcoin is showing price is about to “breakout” from consolidation on the daily, weekly, and monthly time frames:
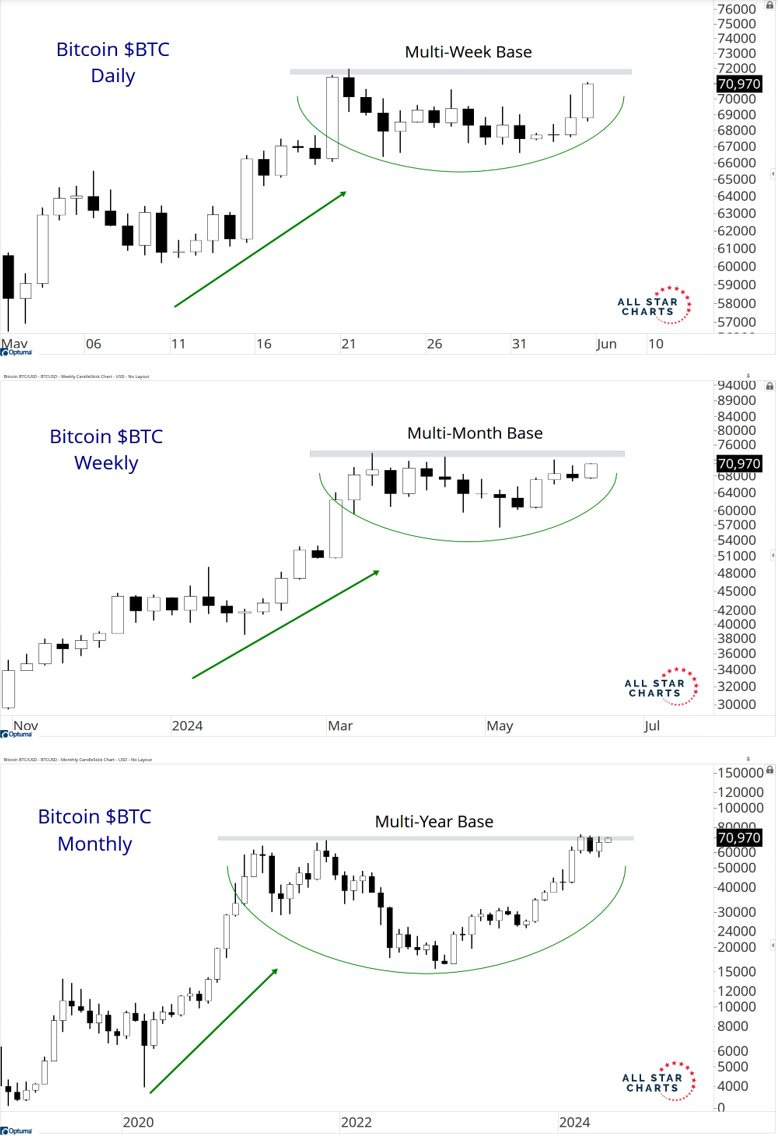
That is extremely rare. As someone who’s worked as an investment analyst since 2011, I’m not sure I’ve ever seen this before.
And it’s bullish for Bitcoin investors. For one, When an asset shows signs of breaking out across multiple time frames, it indicates that the underlying trend is powerful and has the potential to attract significant buying interest.
Moreover, the increasing volume during this consolidation phase hints at accumulation by large investors, who are positioning themselves ahead of the next major move. This adds further credibility to the bullish outlook.
Given these technical indicators - on top of the bullish fundamental and sentiment indicators - now appears to be an opportune moment to invest in Bitcoin before its next leg higher.
Why Now is a Good Time to Invest
Because Bitcoin's consolidation phase seems to be ending, the stage is set for a substantial breakout.
With a target price of $165,000 and strong technical signals, now is an excellent time to consider adding Bitcoin to your portfolio.
Whether you buy the cryptocurrency directly on Coinbase or through an ETF (personally, I own both), now is a time to be optimistic about your crypto holdings.
And if my thinking changes, you’ll be the first to know.
Stay safe out there,
Robert