


The Market’s Pivotal Hour Has Arrived
Answering the biggest question on Wall Street...

Before we get started, I wanted to let you know the third episode of my new podcast Room to Run is live on Spotify and Apple Podcasts.
In this week’s episode we discussed:
Is the Federal Reserve’s 50 basis point cut a good or bad sign?
Is the US on the brink of recession?
How to manage your portfolio with stocks at all-time highs
Preview of next week’s market moving events
Each 10-minute episode can be listened to for FREE on Spotify and Apple Podcasts. If you enjoy the podcast, please leave a review.
Where are we in the market cycle?
For over a century, the U.S. economy has been a series of dramatic booms and devastating busts. The world’s largest economy tends to expand for several years, driven by growth in consumer spending, business investment, and innovation, before contracting as this growth leads to high inflation and interest rate hikes, which causes asset bubbles to burst, thus restarting the process.
And this dynamic is not a new phenomenon.
A Walk Down Market Cycle Memory Lane
In the 1920s we had the Roaring 20s, driven by rapid industrial growth and technological innovation as automobiles and radios became commonplace. However, this boom eventually led to a bust where the stock market crashed by 80% and led to the Great Depression, one of the worst “busts” in history.

After World War II, we then had a post-war boom. Rising consumer demand, suburbanization, and the GI Bill fueled housing and education spending that continued through the 1960s, leading to a major boom in the Nifty Fifty stocks.
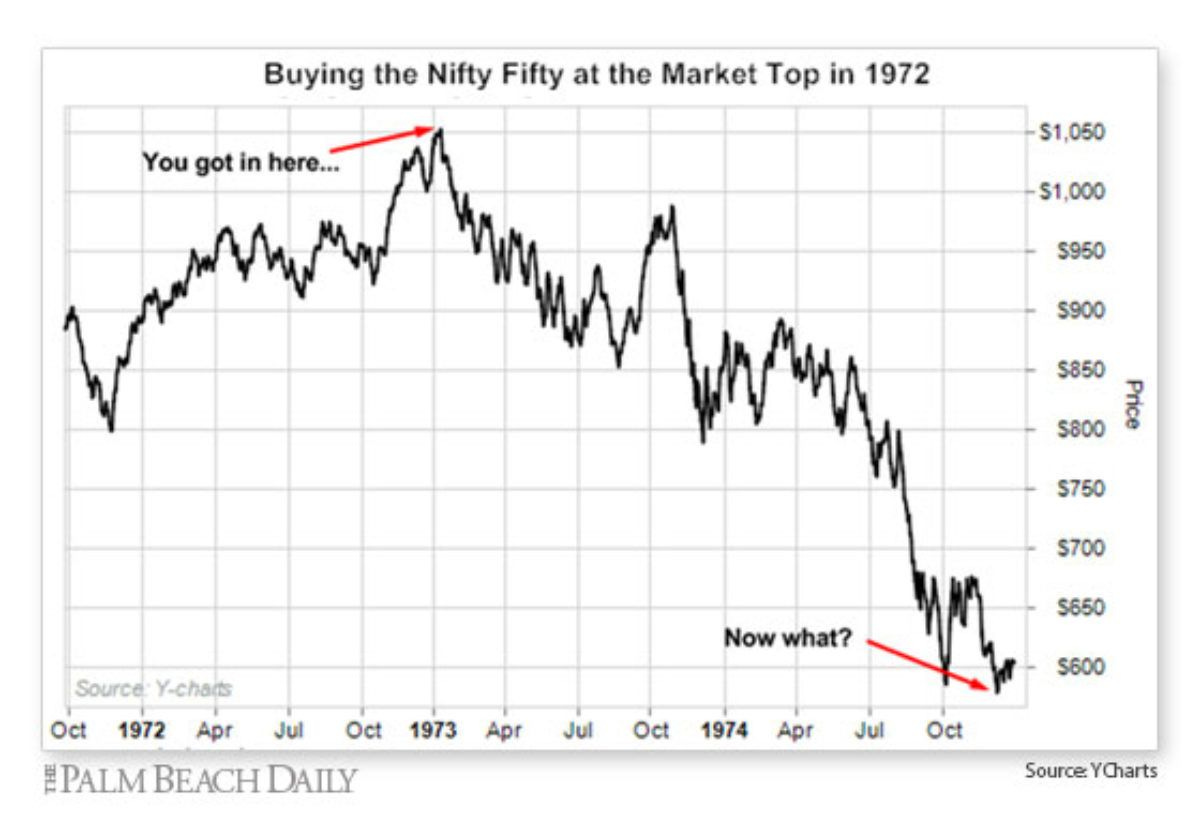
That was until we had a period of high inflation and slow economic growth in the early 1970s, also known as stagflation. This was made worse by the OPEC oil embargo in 1973, which made inflation even worse and led to Federal Reserve chairman Paul Volker to raise interest rates to “break the back” of inflation, leading to a “bust” and weak period for the stock market.
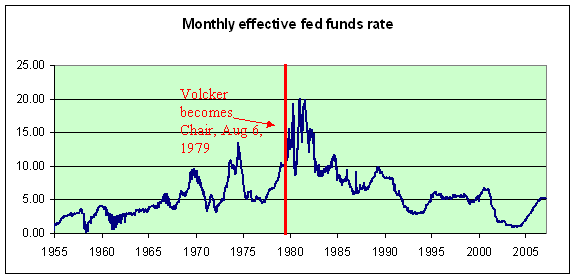
Once interest rates started to be lowered again in the early 1980s, we saw a massive economic boom driven by these low rates, Reagan’s tax cuts, deregulation, and the advent of the personal computer. This continued into the year 2000 when the Fed started hiking rates again and the Dot Com Bubble burst, another famous “bust”.
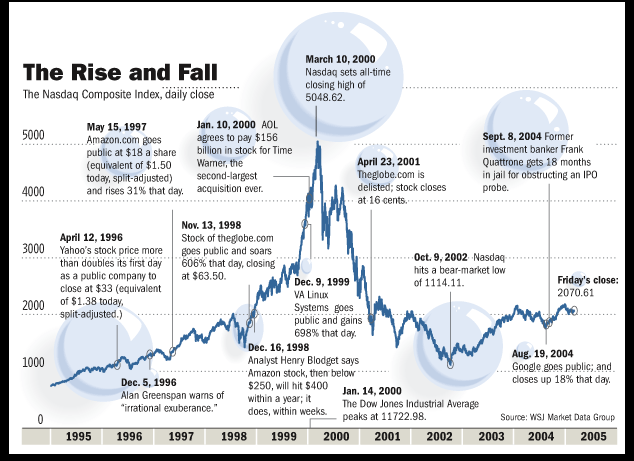
But the high interest rates didn’t last, and by 2004 interest rates set by the Federal Reserve had fallen from a 2000 high of 6.5% to 1.0%. These low interest rates and lax regulation fueled a housing boom in the 2000s until the Federal Reserve raised interest rates back above 5% to choke rising inflation, which was too little too late and ended with the Great Recession and global financial crisis.

Like in any crisis, the Federal Reserve cut interest rates yet again in 2009 to 0%, the lowest ever, and kept them there for seven years. These low rates, quantitative easing, and the rise of the smartphone led to a massive economic boom and new bull market, which ended with a COVID bust in 2020, followed by the post-COVID boom and inflation spike in 2022, which led to another bust.
The Pattern is Clear
An astute investor likely already recognized the familiar pattern.
The US economy starts to boom thanks to low interest rates and a new technology like the automobile, personal computer, or smartphone
This persists until inflation starts to rise
Then the Federal Reserve raises interest rates to quell economic activity and contain inflation
This leads to a recession and/or market downturn
But the question is: where are we currently in this cycle? The investment research team at Merrill Lynch developed a useful framework to gauge where we are in the economic cycle.
It goes like this: boom, slowdown, recession, recovery…
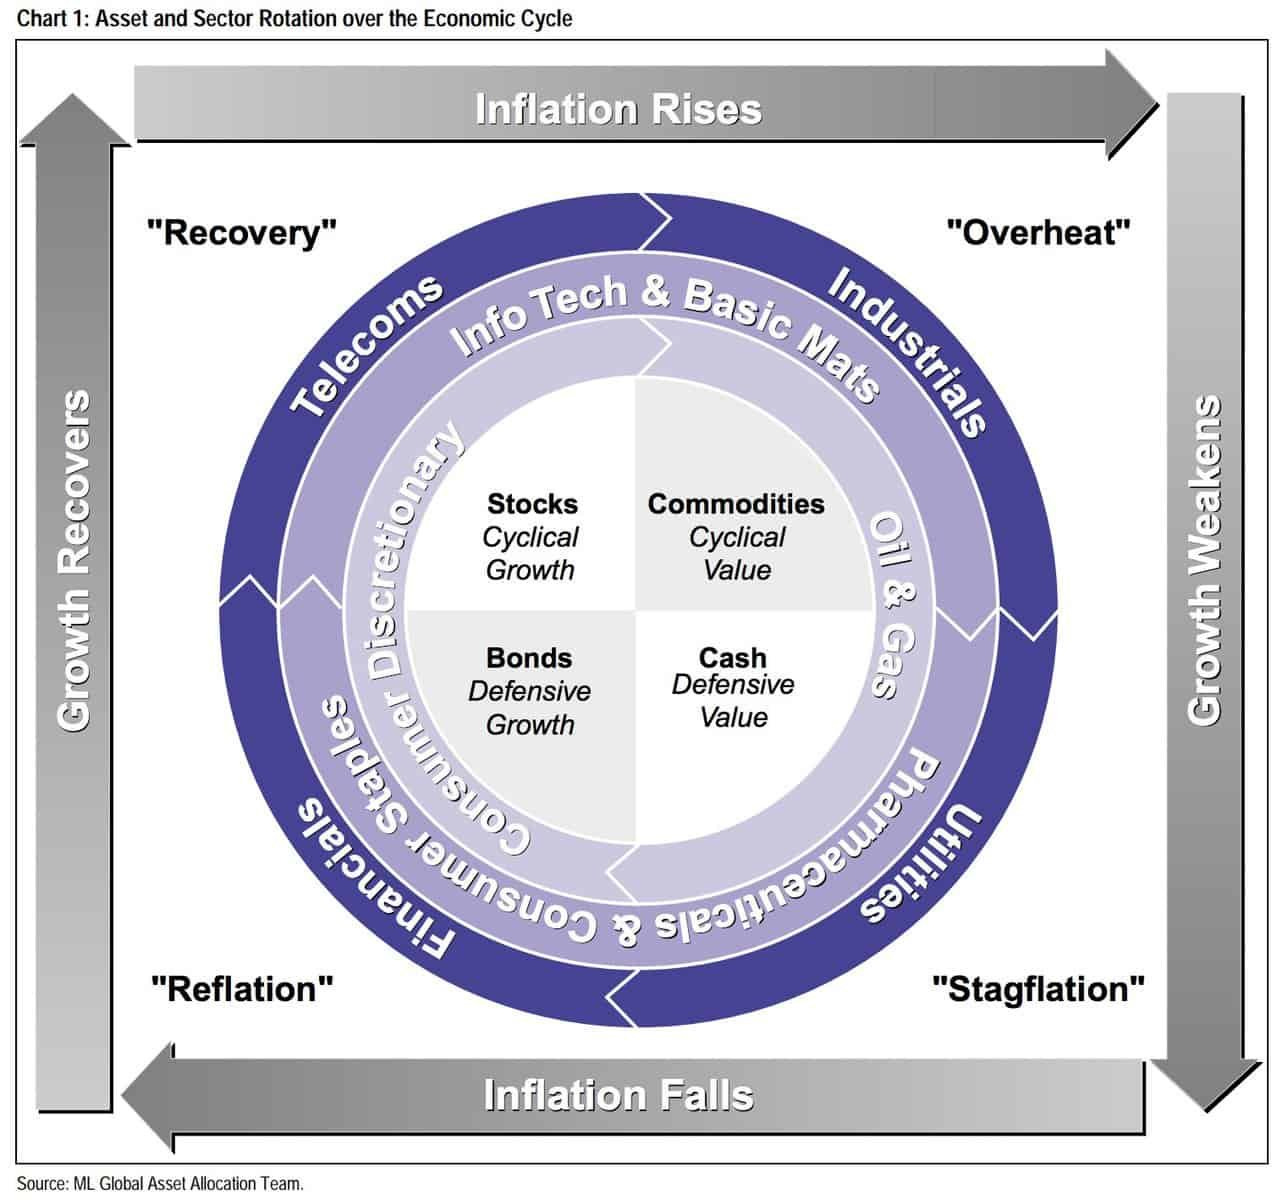
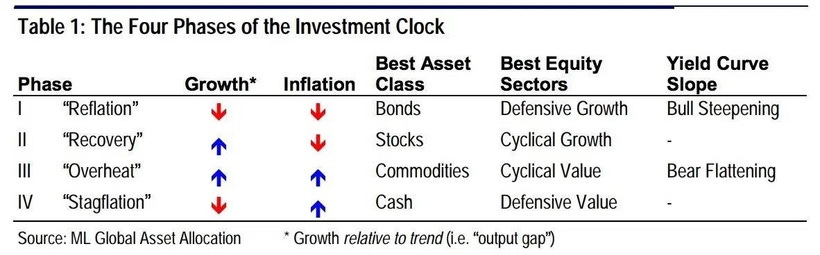
…and then it starts over. This “investment clock” splits the business cycle into four phases. Each phase consists of the direction of growth and inflation relative to their trends.
The recession stage is usually in a bear market, where we have low economic growth and low inflation. This leads to the recovery, where low interest rates drive growth, which leads to the boom stage where strong growth leads to high inflation. This leads the Federal Reserve to raise interest rates, leading to slowdown while inflation remains high.
So where are we in this current cycle?
Here’s Where I Think We Are
Let’s look at the facts.
Inflation is down from 4.3% in April last year to 2.5% in Wednesday’s CPI report.
GDP growth continues to rise, with the Atlanta Fed expecting a 2.5% reading for next quarter.
The Federal Reserve is at the beginning of a massive rate cut cycle, with 200 basis points or 2% worth of cuts expected in the next 12 months.
This tells me we’re likely in the Recovery phase of this cycle. We’re exiting the 2022 overheat stage where the Federal Reserve had to raise rates to fight inflation - like during the 1970s inflation surge, in 2000 before the Dot Com Bubble burst, and 2008 before the Great Recession.
Much like in cycles past, we also have a major technological development with AI causing speculation in the market. Low inflation and steady growth also tell us Recovery is likely the stage of the cycle.
This is also the best time to own stocks, known as the “Goldilocks” phase. This is why I expect the bull market to continue through 2025, barring any major geopolitical issues. It’s also why I’m being fairly aggressive with my portfolio at present (you can see my entire portfolio here).
And while we’ve only scratched the surface of each boom and bust just now, the pattern is clear: low interest rates fuel booms, high interest rates trigger busts.
With a major rate cut cycle just beginning, this suggests that stocks should continue performing well.
But, as always, if my thinking changes, you’ll be the first to know.
Stay safe out there,
Robert