


The Four Most Important Charts in Investing
It's important to understand all of these...

Before we get started, I wanted to thank everyone who listened to my podcast this year on Spotify and Apple Podcasts.
We don’t have a new podcast this week. But you can listen to one of our previous episodes, particularly one of these three which were our most listened to this year:
“A Market Regime Change is Upon Us” Aug. 4, 2024 (Spotify and Apple Podcasts)
“How to Find the Next Nvidia” Aug. 25, 2024 (Spotify and Apple Podcasts)
“What Trump 2.0 Means For Your Portfolio” Nov. 10, 2024 (Spotify and Apple Podcasts)
Each 10-minute episode can be listened to for FREE on Spotify and Apple Podcasts. If you enjoy the podcast, please leave a review.

This is the time of year to reflect and be thankful.
For me and my family, I’m especially grateful for the permabears. Without their endless predictions of global recessions, U.S. dollar collapse, and looming bear markets, our returns wouldn’t have been nearly as strong over the past two years.
And strong they have been. Despite a slower end to the year, the TikStocks Portfolio is up 45% in 2024, following an impressive 36% gain in 2023:

To put that in perspective, the S&P 500 typically returns about 10% annually. In just two years, we’ve generated what would normally take eight years to achieve with the index.
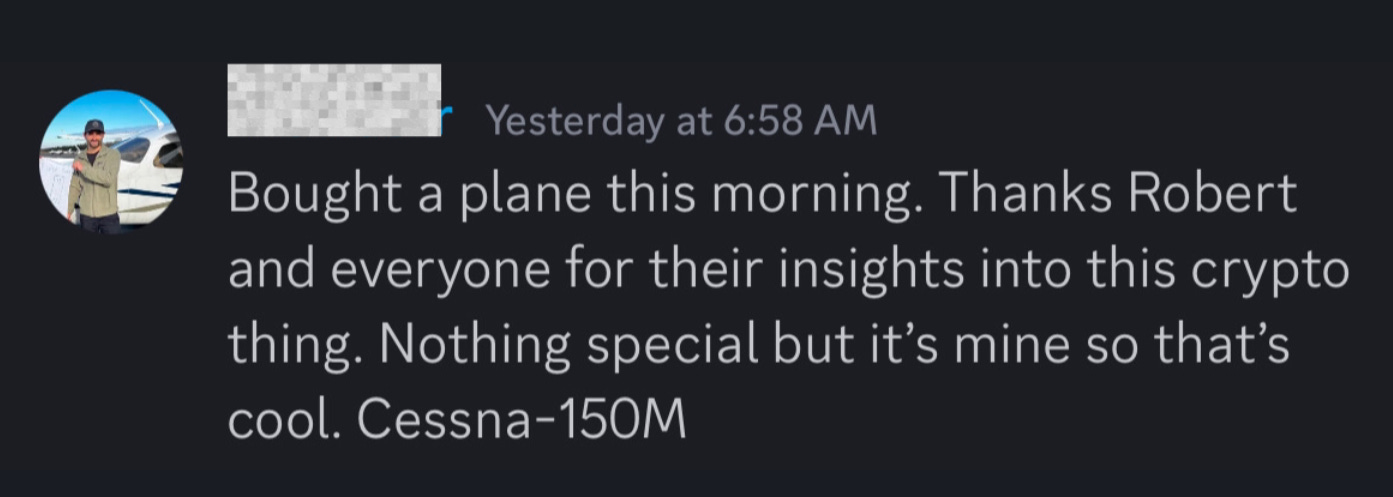
These results are why one TikStocks Portfolio member was able to buy himself a personal plane…
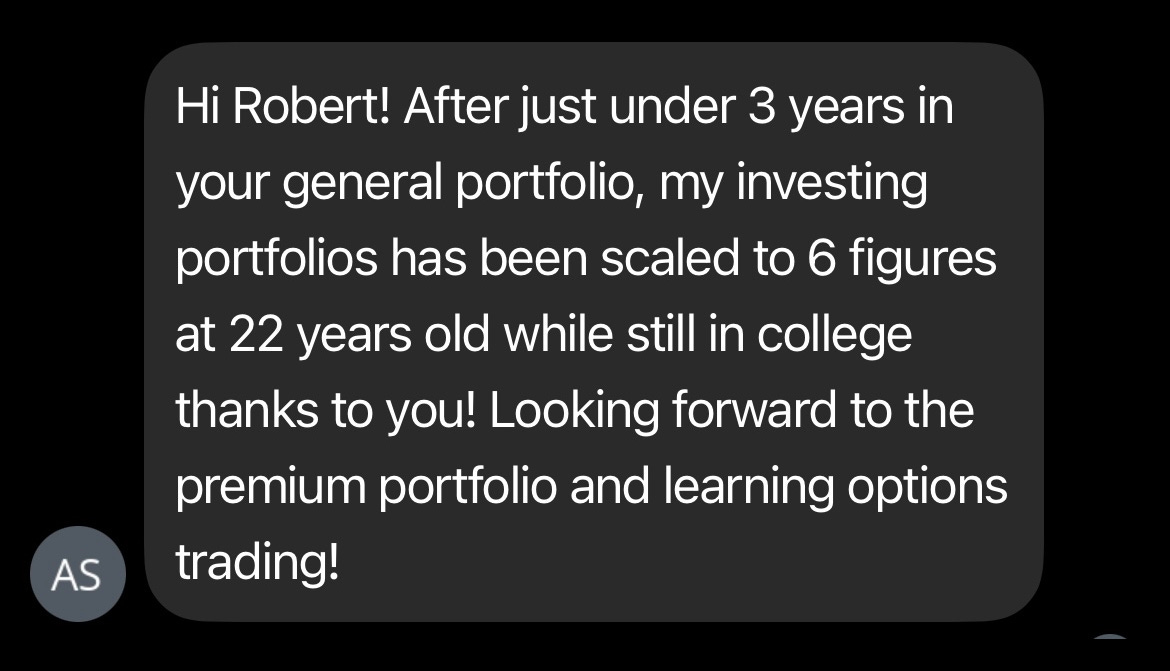
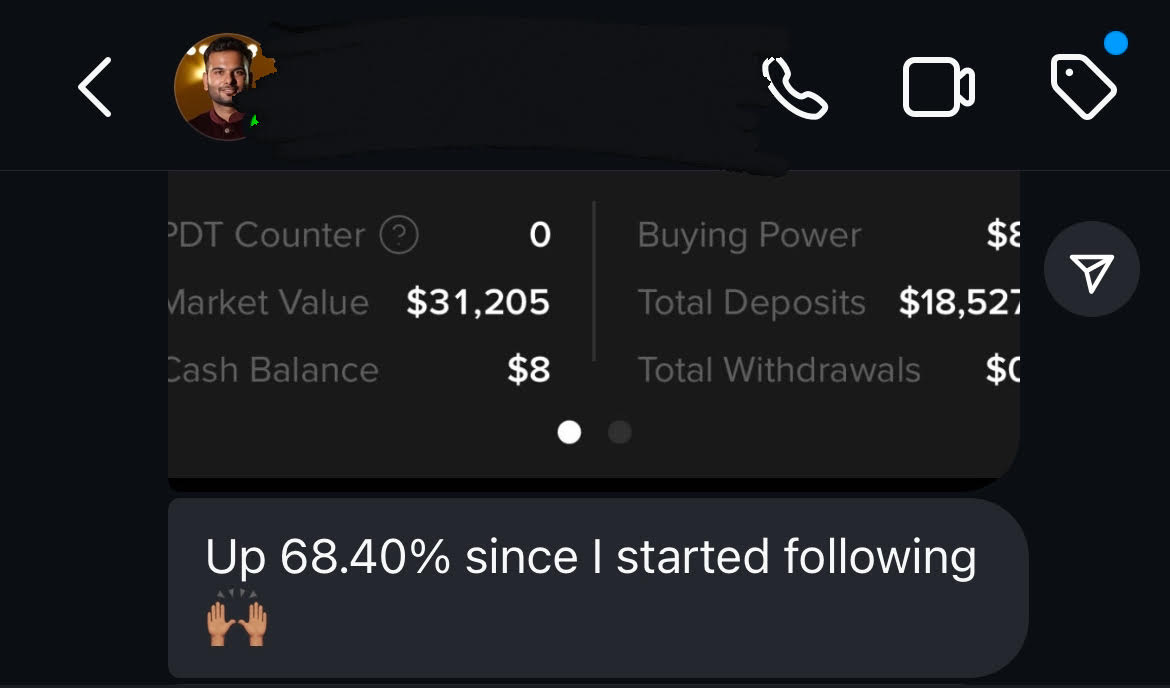
...and another grew their portfolio to over six figures before even graduating college.
If you want to join the 1,000+ members in our investing community, click here to get three months FREE off your annual subscription before the deal ends New Years Day.
But even if you’re not ready to join our community, I recommend paying close attention to these four investing charts.
They’ve been instrumental in helping me consistently outperform the market—and they can do the same for you.
Chart #1: There Are Always Reasons to Sell
You may have seen “permabears” like this guy on your YouTube algorithm:
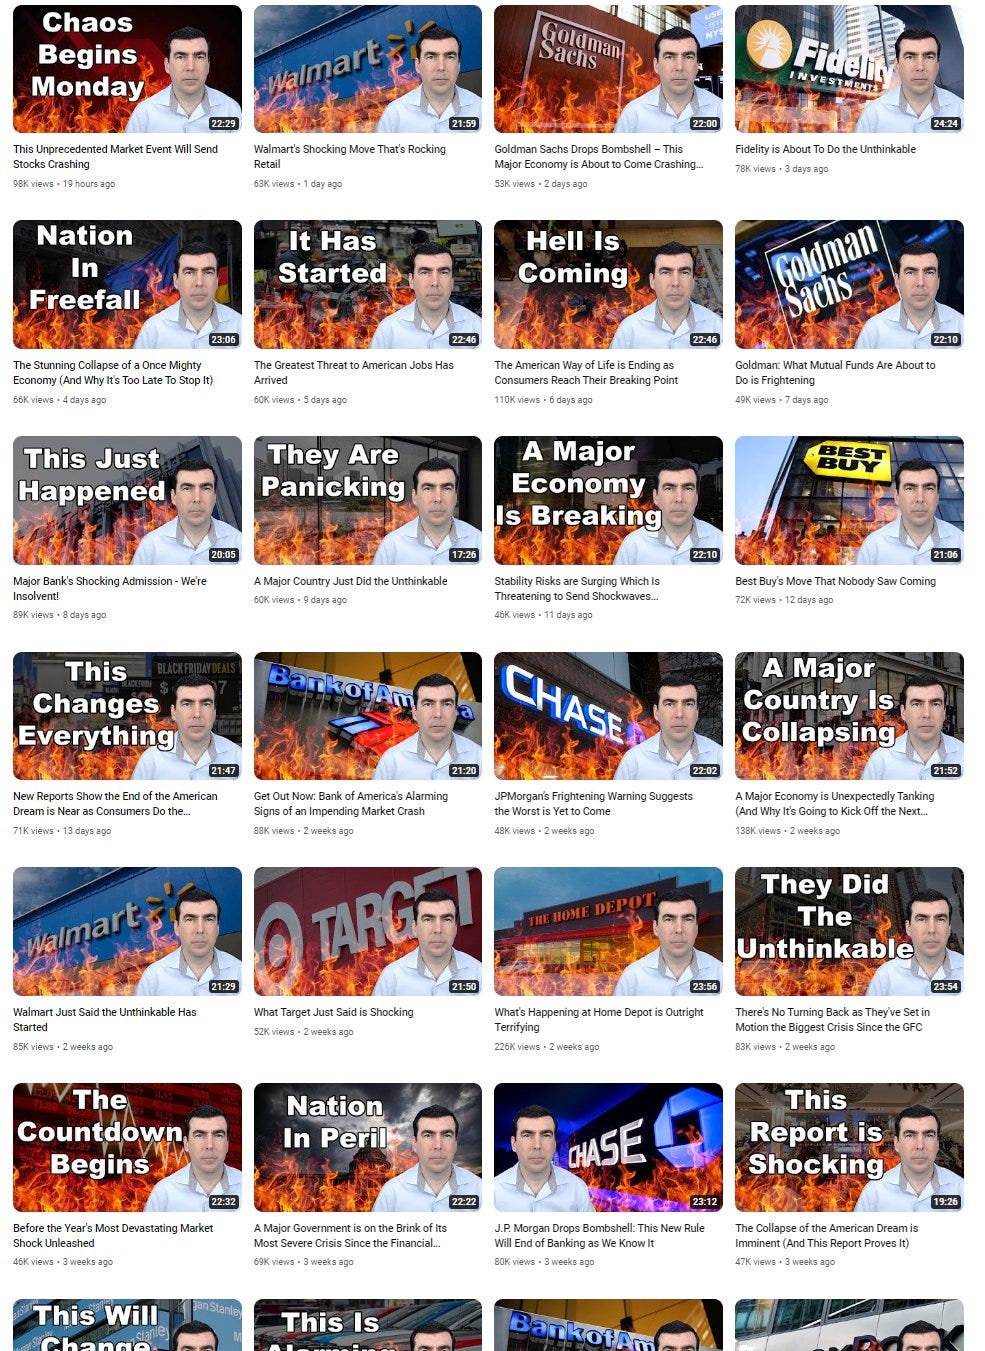
Creators like him always focus on the worst things happening in the markets. They want to make you worry, and likely buy physical gold (and, of course, buy their course).
But as Peter Lynch put it 40 years ago, markets tend to climb a “wall of worry.”

Lynch says investors constantly face a barrage of worrisome information. This includes economic downturns, geopolitical issues, or market volatility… like a looming recession, an unwinding carry trade, or other unlikely scenarios.
Despite these worries, Lynch encourages investors to maintain a long-term perspective. By navigating through the "wall of worry" and staying focused on the fundamental strength of their investments, you can benefit from the overall growth of the market over time.
There will always be things to worry about. But selling your stocks when things look “bad” is the worst thing you can do.
Chart #2: It Pays to Be a Long-Term Bull
Everyone focuses too much on bear markets.
Yes, as we saw in 2022, bear markets do happen. And they are painful.
However, they are also rare and - historically - always buying opportunities.

Bear markets are also much shorter than bull markets. The average bull market lasts 991 days compared to 289 for bear markets. That means bull markets last nearly three-times longer than bear markets.
This alone makes it worthwhile to have a “bullish bias.”
Chart #3: Volatility is Normal
New investors often get nervous when stocks are volatile.
They incessantly check their portfolios, seeing how much its value has changed. And on red days, all they want to do is sell.
But that’s the worst thing you can do. As this chart shows, even during years when the stock market is up over 20%, we often have pullbacks of 20% or more:
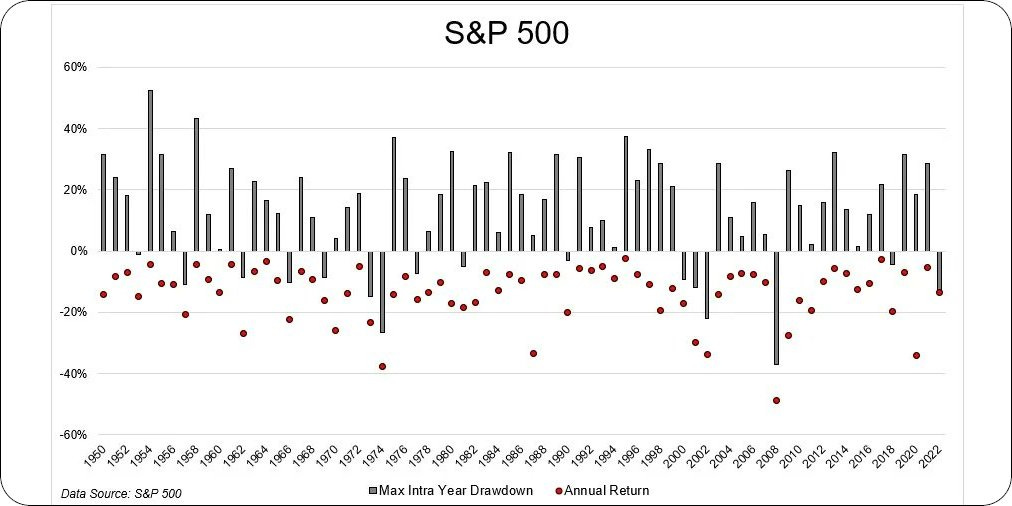
Your goal should be to not get “shaken out” of your portfolio positions on red days.
Because when it comes to stocks, you are rewarded with higher returns because of this volatility.
Chart #4: Time is Your Best Friend
When people start investing, they often want to be a “trader.”
They see movies like The Big Short or Wall Street and find the allure of putting on high-risk, directional bets appealing.
But in reality, that’s not how you make money. In fact, the odds of making money on your position goes up dramatically the longer you hold:
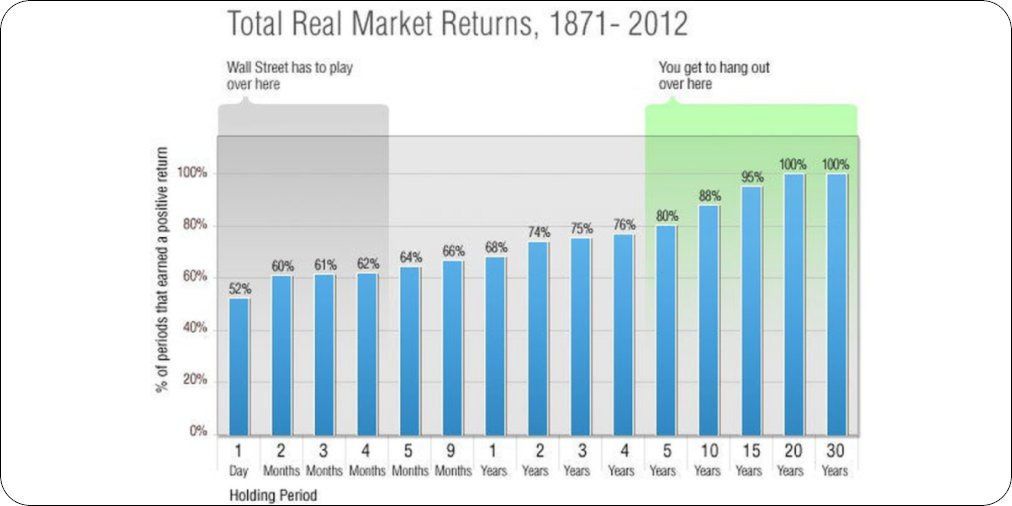
As this chart shows, the odds of your S&P 500 investment being in positive territory is 80% after five years. And after 20 years? It’s 100%.
Trading in and out of positions may seem appealing. But if you’re looking to have math on your side, long-term investing is the way.
Keeping Your Eyes on the Prize
Investing success comes from staying disciplined and focusing on the long term. The charts above highlight why sticking to a proven strategy and avoiding emotional decisions is key to building wealth.
If you’re ready to take your investing to the next level, there’s no better time to join the TikStocks Portfolio. Our members have consistently outperformed the market, and now you can too.
Right now, I’m offering an exclusive three months FREE with an annual subscription—but this offer expires on New Year’s Day. Don’t miss your chance to start 2024 with actionable trade alerts, exclusive insights, and one of the best-performing portfolios around.
Click here to claim your spot before the clock runs out! Let’s kick off the new year with a winning strategy.
Stay safe out there,
Robert
Having successfully predicted 11 of the last 2 recessions, I fully support your perspective (chart #2) on taking a long-term view. I managed to stay disciplined through some downturns, though, and have come out on the right side.