


Is This a New Bear Market?
These three indicators will give us an answer…

Before we get started, I want to welcome the +47 subscribers who signed up for the Let’s Analyze newsletter in the last week! If you want to join our community, make sure to sign up here:
Lots of investors are scratching their heads right now.
And that includes me, as the market is sending more mixed signals than an awkward first Tinder date. We have stocks falling like a recession is coming, yet home prices are rising like we’re in an expansion.
We also have US government bonds crashing like the Federal Reserve is raising rates, yet gold is climbing like the central bank is cutting rates.
Since these usually reliable indicators are sending an unclear message, we need to turn our attention to a few other key metrics that can give us a glimpse where markets are headed…
…and I have three I’m currently watching closely.
Indicator #1: The 200-Day Moving Average
I don’t consider myself a “top down” technical analyst.
However, during major market inflection points (like we’re in now) technical analysis can paint a picture of what the market “setup” is telling us.
And if there’s one technical indicator to watch, it’s the 200-day moving average which is the average closing price of the S&P 500 index over the past 200 trading days. This moving average provides a smoothed trend line that helps investors identify the long-term direction of the market (you can see it in red below):

When the S&P 500’s price is above this moving average, it's often considered a bullish sign and indicates a strong upward trend. And when the S&P 500’s price falls towards or touches the 200 DMA, it may find buying interest, helping prevent further declines.
But if the index falls below the 200-day moving average, it often indicates a change in trend for the market.
And as you can see in the above chart, the S&P 500 is close to touching the 200-day moving average. If we break below that red line on strong volume, it will be a very bearish sign for the market as a whole.
But it’s not the only indicator I’m keeping an eye on.
Indicator #2: Big Tech Earnings
I talk a lot about “earnings” in this newsletter.
When I say earnings, I mean how much a company earned in total profit - the amount of money a business makes after subtracting all its expenses - in the latest quarter or year.
There’s a reason I talk about earnings a lot; it’s what makes stocks “go up.”
And we have a slate of earnings coming up. Many of you know that seven stocks have driven the stock market higher this year:

Without these seven stocks – which are up and average of +40% - the S&P 500 is actually down for the year. And over the next few weeks, six of these seven companies will report earnings:

If these earnings come in weaker than expected, the seven companies “propping up” the market will fall… leading to a fall in the broader market. But if earnings come in in-line with expectations, the market will breathe a sigh of relief and likely head higher.
But there’s one more key indicator investors need to track.
Indicator #3: US Government Bond Yields
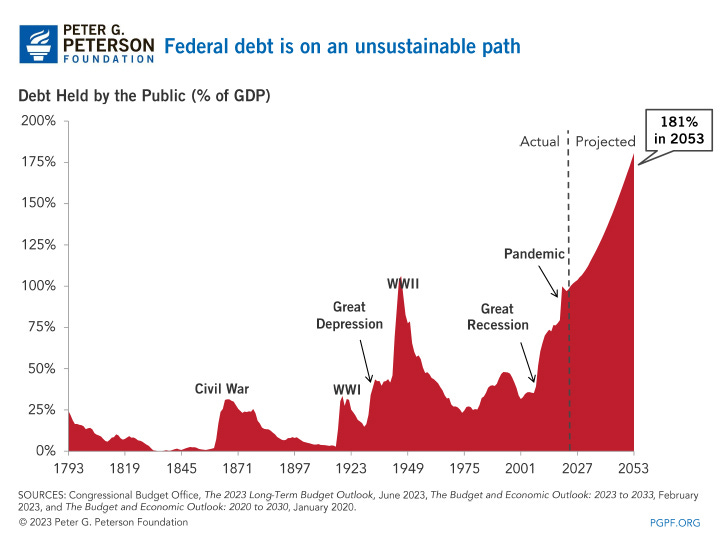
US government bonds – or “treasuries” – are currently in their worst bear market in US history.
These historically “safe” bonds have crashed -50% since 2021…

…namely due to high inflation, the Fed raising interest rates, and a ballooning national debt:
There are a few reasons this is bad for stocks. First, higher bond yields make bond investments like Treasuries more attractive compared to stocks because they offer better returns with less risk.
For instance, the S&P 500 has delivered an average gain of +9% over the last 100 years. If you can get +5% risk-free from Treasuries, many people would rather take the guaranteed return than risk their money on stocks (which is exactly what I’ve done with 10% of my personal portfolio).

Second, when interest rates on Treasuries increase, borrowing costs for companies rise. This can hurt corporate profits as they have to pay more to service their debts.
Additionally, higher bond yields can prompt concerns about inflation. If investors expect inflation to erode the value of future stock returns, they may become more cautious about stocks, leading to selling pressure.
I Don’t Know What the Future Holds
I went on record earlier this month saying the bottom for stocks is in.
For now, I am sticking by that call. But if the 200-day moving average is breached, Big Tech earnings come in lower than expected, and bond yields continue to rise, I will start being much more “defensive” with my portfolio.
And you probably should to.
Stay safe out there,
Robert