


How to Tell When Stocks Hit Bottom
Three clues that will signal an end to the bear market...

Before we get started, I want to welcome the 2,280 subscribers who signed up for the Let’s Analyze newsletter in our first week! If you want to join our community, make sure to sign up here:
It’s been a tough stretch for stocks.
2022 was the worst year for the S&P 500 since the Global Financial Crisis in 2008.
So it makes sense that this question is on the tip of most investors’ tongue:

Let’s try and answer this question today.
Time in the Market Still Reigns Supreme
Before we get started, I want to make clear there’s no way to know for sure when stocks will bottom. Even the best investors on the planet can only give you an educated guess.
That’s why it’s better to stay invested in the market and not try and “time” anything.

But that’s doesn’t mean we can’t use historical market trends to forecast when stocks may bottom.
And I have a few I’m watching closely.
Bottom Indicator #1: S&P 500 Earnings Recession
We talked last week about how I expect the S&P 500 to fall an additional -15% in 2023.
This is due to something called an earnings recession.
For starters, an earnings recession and an economic recession are two different things.
Economic recessions – like the Great Recession from 2008 to 2009 – are rare. Since 1948, there have only been 12 economic recessions in the US.

On the other hand, earnings recessions – defined as two quarters of corporate profits below their level from a year earlier – happen more frequently. Since 1948, the US has had 22 earnings recessions.
Since earnings are one of two things that move a stock’s price (the other being a “multiple”), an earnings recession is bad for individual stocks and the broader market.

And we’re about to have a lot of earnings soon; over half of S&P 500 reports earnings in the next month…

…which should give us a hint as to what overall S&P 500 earnings will look like this year.
Because in the Q4 earnings cycle, S&P 500 earnings actually fell -4.1% year-over-year…

…which marked the first time the index reported a year-over-year earnings decline since 2020.
The coming earnings cycle will signal whether this was the beginning of an earnings recession or simply a bad quarter.
And if it is the beginning of an earnings recession, we should see further downside in stocks. This is my base case for 2023 and is a key reason I expect another -15% decline in the S&P 500.
But once we’ve seen earnings decline for a few quarters, it will be clear the bottom for stocks is near.
Bottom Indicator #2. The Fed Pivot
The stock market will likely bottom when the Federal Reserve stops raising interest rates and begins lowering them.
This is known as a policy pivot and will happen once it’s clear inflation is headed towards the Fed’s 2% target. While the latest Consumer Price Index (CPI) report came in at a high 7.1%, the inflation rate is rapidly falling.
This may seem counterintuitive until you realize CPI and inflation are very different.
The CPI is made up of changes in a basket of goods and services:
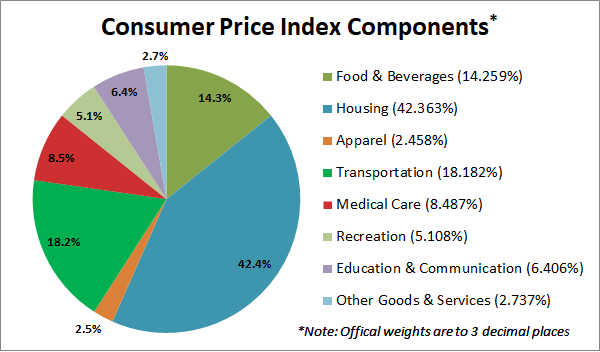
30% of this CPI reading is known as Owners’ Equivalent Rent (OER) which looks at housing prices. The latest report shows OER is up 0.7% (or 8.4% annualized) month-over-month.
But this data is very old. In fact, the latest OER data shows what housing was like in Fall 2021.
As someone who’s looking to buy a house in the next 12 months and is addicted to the Zillow app, I can tell you most housing price charts in Los Angeles look like this…

…which makes sense since housing affordability is near decade lows:

A better measure of current housing dynamics comes from the Case-Shiller Index.
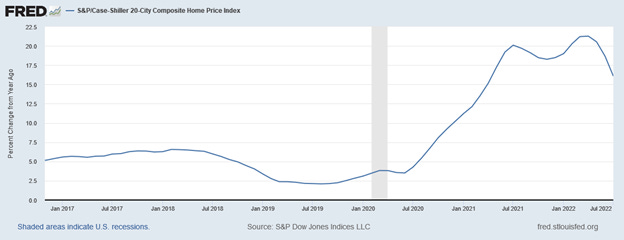
When substituted for the OER, the CPI is currently experiencing deflation rather than inflation. This means we could be closer to a more dovish Fed than most people think.
And once it’s clear the Fed is ready to be accommodative, the bottom will likely be in.
But I’ll be looking for one more sign of a bottom before getting too excited.
Bottom Indicator #3: Widening High-Yield Bond Spreads
During times of stress in the financial system, the “spread” between risky (i.e. high-yield) and risk-free (i.e. US government) bonds tends to widen.
For instance, look at how this spread surged during the Global Financial Crisis, the Taper Tantrum, Brexit, and the COVID-19 Lockdowns:

The widening of this spread between “risky” and “risk-free” bonds is a telltale sign that investors are panicking.
And before any bottom in stocks has historically been made, investors usually exhibit this type of panic. This is similar to watching the CBOE Volatility Index (VIX) – or “fear index” – which also tends to surge when stocks bottom:

While not as important as #1 and #2, this type of panic is usually the death knell of any bear market.
Keep Your Eyes on the Prize
My goal is to always to keep you a step ahead of where the markets are headed.
While it's possible we see more downside in stocks this year due to an earnings recession, it's important to remember the S&P 500 has always made new all-time highs after bear markets, economic recessions, and earnings recessions.

Stocks do not go up in a straight line. And there could be more pain ahead. But these bumpy periods in market history are where investors create massive amounts of long-term wealth.
So don’t let short-term noise derail you from your long-term investing goals.
Stay safe out there,
Robert